

1. Objective of the Experiment
1.1. This experiment aims to determine optimal storage conditions for a 5% Lutein Product by investigating the effects of factors such as temperature, humidity, and light exposure. The assessment includes evaluating the product's appearance, active content, and loss on drying.
2. Experimental Protocol
2.1. Temperature Influence Study:
Samples of the 5% lutein product are placed in constant-temperature drying ovens at 25°C, 40°C, and 60°C. At intervals of 12 h, 24 h, 48 h, 60 h, 10 days, 15 days, and 30 days, the lutein content and appearance (color) are measured to determine the impact of temperature.
2.2. Light Influence Study:
Samples of the 5% lutein product are placed in a light-exposure chamber (illuminance: 4500 lx). At intervals of 12 h, 24 h, 48 h, 60 h, 10 days, 15 days, and 30 days, the lutein content and appearance (color) are measured to determine the impact of light exposure.
2.3. Humidity Influence Study:
Samples are placed in environments with 92% and 75% relative humidity. At intervals of 12 h, 24 h, 48 h, 60 h, 10 days, 15 days, and 30 days, the lutein content, loss on drying, and appearance are measured to determine the impact of humidity.
3. Experimental Procedure and Results
3.1. Temperature Influence Study
3.1.1. Study at 25°C
3.1.1.1. Take 10 g of the 5% lutein product (batch no. 20150511), spread it evenly in a watch glass, and place it in a drying oven at 25°C, ensuring it is protected from light. Collect samples at 12 h, 24 h, 48 h, 60 h, 10 days, 15 days, and 30 days to assess the appearance and content, and calculate the degradation rate.
|
Time |
0 h |
12 h |
24 h |
48 h |
60 h |
10 days |
15 days |
30 days |
|
Color |
Orange-yellow |
Orange-yellow |
Orange-yellow |
Orange-yellow |
Orange-yellow (fading) |
Pale orange-yellow |
Yellow |
Pale yellow |
|
Content (%) |
5.28% |
5.25% |
5.2% |
5.19% |
4.95% |
4.73 |
4.06 |
3.75 |
|
Degradation rate (%) |
0% |
0.57% |
1.52% |
1.7% |
6.25% |
10.42 |
23.11 |
28.98 |
Table 1. Experiment on Factors Influencing Results at 25°C
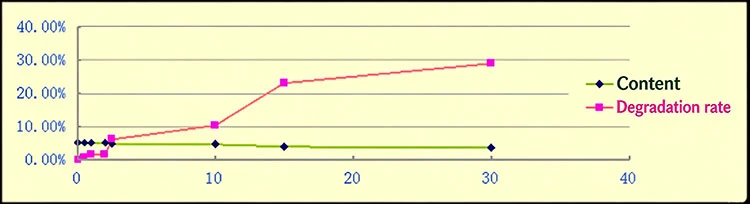
Figure 1
As shown in Table 1 and Figure 1, the lutein content remains relatively stable at 25°C for the first 48 hours; however, the degradation rate reaches 6.25% by day 5 and 28.98% by day 30, indicating that both the appearance and content of lutein undergo significant changes after 48 hours at 25°C.
3.1.1.2 Take 10 g of 5% lutein and place it in a watch glass. Store the sample in a drying oven at 25°C, ensuring it is kept away from light. Collect samples at 12 h, 24 h, 48 h, 60 h, 10 days, 15 days, and 30 days; determine the appearance and content, and calculate the degradation rate.
|
Time |
0 h |
12 h |
24 h |
48 h |
60 h |
10 days |
15 days |
30 days |
|
Color |
Orange-yellow |
Orange-yellow |
Orange-yellow |
Orange-yellow |
Orange-yellow | Orange-yellow | Orange-yellow | Orange-yellow |
|
Content (%) |
5.28% |
5.28% |
5.27% |
5.27% |
5.26% |
5.25% |
5.25% |
5.25% |
|
Degradation rate (%) |
0% |
0% |
0.19% |
0.19% |
0.38% |
0.57% |
0.57% |
0.57% |
Table 2 Experiment on the Influence of Temperature (25°C) – Vacuum Packaging
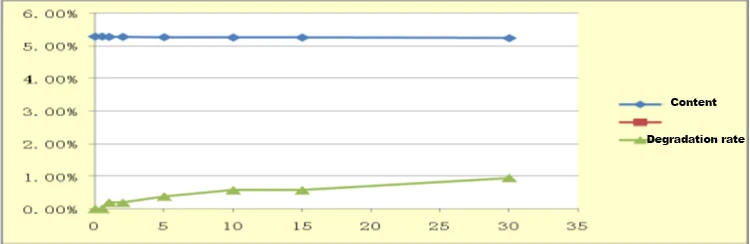
Figure 2
As shown in Table 2 and Figure 2, the lutein content remains relatively stable at 25°C over a 30-day period, with a maximum degradation rate of 0.57%. This indicates that both the appearance and content of lutein show no significant change after 30 days at 25°C. An analysis of the data in Tables 1 and 2 suggests that the primary factor driving changes in lutein content and color is oxidation by atmospheric oxygen (in non-vacuum conditions), whereas temperature-at least at 25°C-has a minimal impact.
3.1.2 Experiment on Factors Influencing Results at 40°C
3.1.2.1 Spread 10 g of 5% lutein evenly in a watch glass and place it in a drying oven at 40°C, ensuring it is kept away from light. Collect samples at 12 h, 24 h, 48 h, 60 h, 10 days, 15 days, and 30 days; determine the appearance and content, and calculate the degradation rate.
|
Time |
0 h |
12 h |
24 h |
48 h |
60 h |
10 days |
15 days |
30 days |
|
Color |
Orange-yellow |
Orange-yellow |
Orange-yellow, lighter in color than at 12h |
Orange-yellow, lighter in color than at 12h |
Yellow |
Pale yellow |
Pale yellow |
Pale yellow |
|
Content (%) |
5.28% |
4.77% |
4.62% |
3.97% |
1.15% |
0.07% |
0.00% |
/ |
|
Degradation rate (%) |
0% |
9.66% |
12.50% |
24.81% |
78.22% |
98.71% |
100% |
/ |
Table 3. Experiment on Factors Influencing Results at 40°C
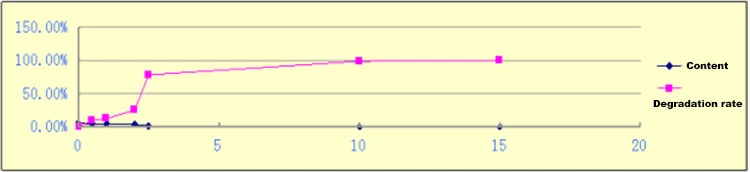
Figure 3
As shown in Table 3 and Figure 3, the lutein content changes significantly after 12 hours at 40°C; the degradation rate reaches 78.22% by day 5 and 100% by day 15, indicating that both the appearance and content of lutein undergo marked changes after 12 hours at 40°C.
3.1.2.2 Place 10 g of 5% lutein (in vacuum packaging) onto a watch glass and store it in a drying oven at 40°C, ensuring it is kept away from light. Collect samples at 12 h, 24 h, 48 h, 60 h, 10 days, 15 days, and 30 days; determine the appearance and content, and calculate the degradation rate.
|
Time |
0 h |
12 h |
24 h |
48 h |
60 h |
10 days |
15 days |
30 days |
|
Color |
Orange-yellow |
Orange-yellow |
Orange-yellow |
Orange-yellow |
Orange-yellow |
Orange-yellow |
Orange-yellow |
Orange-yellow |
|
Content (%) |
5.28% |
5.28% |
5.27% |
5.21% |
5.20% |
5.18% |
5.16% |
5.15% |
|
Degradation rate (%) |
0% |
0% |
0.19% |
1.33% |
1.52% |
1.89% |
2.27% |
2.46 |
Table 4: Experiment on Factors Influencing Stability at 40°C – Vacuum Packaging
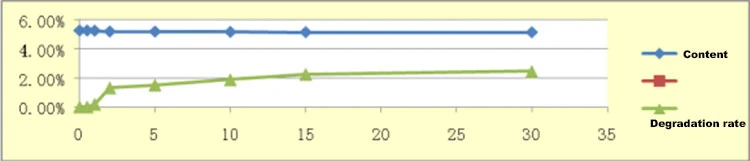
Figure 4
As shown in Table 4 and Figure 4, the lutein content remained relatively stable at 40°C over a 30-day period, with a maximum degradation rate of 2.46%. This indicates that both the appearance and content of lutein show no significant change after 30 days at 40°C. Based on the data in Tables 3 and 4, it can be inferred that the primary cause of changes in lutein content and color is oxidation by atmospheric oxygen (in non-vacuum conditions), while temperature-at least at 40°C-has a minimal impact on lutein.
3.1.3 Experiment on the Effect of 60°C Temperature
3.1.3.1 Spread 10 g of 5% lutein evenly in a watch glass and place it in a drying oven at 60°C, ensuring it is kept away from light. Collect samples at 12 h, 24 h, 48 h, 60 h, 10 days, 15 days, and 30 days; determine the appearance and content, and calculate the degradation rate.
|
Time |
0 h |
12 h |
24 h |
48 h |
60 h |
10 days |
15 days |
30 days |
|
Color |
Orange-yellow |
Orange-yellow |
Orange-yellow; color is lighter than at 12h |
Yellow |
Yellow; color is lighter than at 48h |
Pale yellow |
Orange-yellow |
Orange-yellow |
|
Content (%) |
5.28% |
4.77% |
3.97% |
3.45% |
0.16% |
0.01% |
0% |
/ |
|
Degradation rate (%) |
0% |
9.66% |
24.81 |
34.66 |
96.97% |
99.99% |
100% |
/ |
Table 5 Experiment on Factors Influencing Results at 60°C
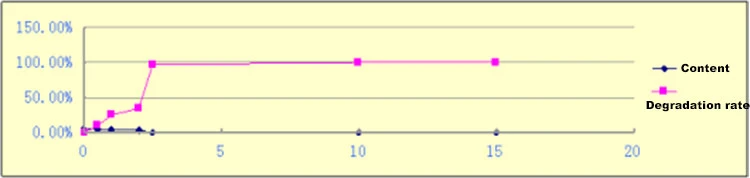
Figure 5
As shown in Table 5 and Figure 5, the lutein content changes significantly after 12 hours at 60°C; the degradation rate reaches 96.97% by day 5 and 100% by day 15, indicating that both the appearance and content of lutein undergo marked changes after 12 hours at 60°C.
3.1.3.2 Place 10 g of 5% lutein (from vacuum-sealed packaging) into a watch glass and store it in a drying oven at 60°C, ensuring it is kept away from light. Collect samples at 12 h, 24 h, 48 h, 60 h, 10 days, 15 days, and 30 days; determine the appearance and content, and calculate the degradation rate.
|
Time |
0 h |
12 h |
24 h |
48 h |
60 h |
10 days |
15 days |
30 days |
|
Color |
Orange-yellow |
Orange-yellow |
Orange-yellow |
Orange-yellow |
Yellow |
Pale yellow |
Pale yellow |
Pale yellow |
|
Content (%) |
5.28% |
5.20% |
5.08% |
4.68% |
4.02% |
3.55% |
2.89% |
2.02% |
|
Degradation rate (%) |
0% |
1.52% |
3.79% |
11.36% |
23.86% |
32.77% |
45.27% |
61.74% |
Table 6: Experiment on Factors Influencing Results at 60°C – Vacuum Packaging
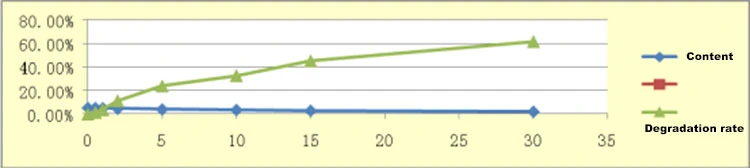
Figure 6
As shown in Table 6 and Figure 6, the lutein content remains relatively stable at 60°C between 0 and 24 hours, with a maximum degradation rate of 3.79% observed at the 24-hour mark; however, a significant decline in lutein content occurs after 48 hours. This indicates that, at 60°C, both the appearance and content of lutein undergo marked changes over a period of 2 to 30 days, demonstrating instability. Based on the data in Tables 5 and 6, it can be concluded that the observed changes in content and color are primarily driven by oxidative degradation due to exposure to air (non-vacuum conditions) and the significant impact of the 60°C temperature on both content and appearance.
Consequently, the experiments regarding temperature-related factors confirm that while temperatures of 25°C and 40°C have minimal impact on lutein, a temperature of 60°C has a substantial effect.
3.2 Experiment on Factors Influencing Stability: Light Exposure
3.2.1. Place 10 g of a 5% lutein sample (batch 20150511, vacuum-packaged) into a watch glass and store it in an illumination chamber at 25°C with a light intensity of 4500 lx. Collect samples at 12 h, 24 h, 48 h, 60 h, 10 days, 15 days, and 30 days; evaluate their appearance and lutein content, and calculate the degradation rate.
|
Time |
0 h |
12 h |
24 h |
48 h |
60 h |
10 days |
15 days |
30 days |
|
Color |
Orange-yellow |
Orange-yellow |
Orange-yellow |
Orange-yellow |
Yellow |
Pale yellow |
Pale yellow |
Pale yellow |
|
Content (%) |
5.28% |
4.98% |
4.63% |
4.25% |
2.42% |
0.86% |
0.53% |
0.12% |
|
Degradation rate (%) |
0% |
5.68% |
12.31% |
19.51% |
54.17% |
83.71% |
89.96% |
97.93 |
Table 7 Experiment on Factors Influencing Light Exposure
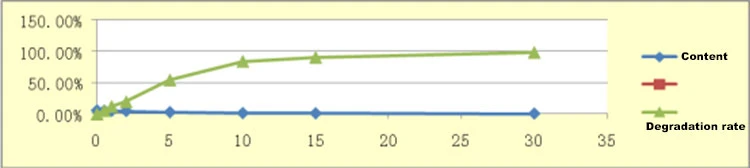
Figure 7
As shown in Table 7 and Figure 7, the lutein content changes significantly after 12 hours of light exposure, with a degradation rate of 5.68%; by 30 days, the degradation rate reaches 97.93%. This indicates that light exposure has a substantial effect on lutein.
3.3 Factors Influencing Stability Under High-Humidity Conditions
3.3.1 Place 10 g of a 5% lutein sample into a watch glass and store it in an environment with 75% relative humidity (maintained using a sodium chloride solution) at 25°C. Collect samples at 12 h, 24 h, 48 h, 60 h, 10 days, 15 days, and 30 days. Determine the appearance, lutein content, and moisture-induced weight gain, and calculate the degradation rate.
|
Time |
0 h |
12 h |
24 h |
48 h |
60 h |
10 days |
15 days |
30 days |
|
Color |
Orange-yellow |
Orange-yellow |
Orange-yellow |
Orange-yellow |
Orange-yellow |
Orange-yellow |
Pale orange-yellow |
Pale orange-yellow |
|
Content |
5.28% |
5.26% |
5.15% |
5.02% |
4.98% |
4.75% |
4.05% |
2.98% |
|
Sample weight |
10.0253g |
10.0352g |
10.0695g |
10.1412g |
10.2562g |
10.3098g |
10.4153g |
10.5002g |
|
Degradation rate |
0% |
0.38% |
2.46% |
4.92% |
5.68% |
10.04% |
23.30% |
43.56% |
|
Weight gain on moisture absorption |
0% |
0.01% |
0.44% |
1.16% |
2.30% |
2.84% |
3.89% |
4.74% |
Table 8: Experiment on Factors Influencing 75% Humidity (25°C)
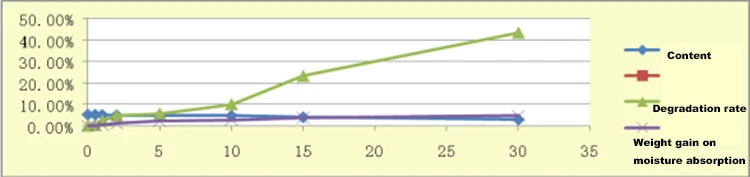
Figure 8
As shown in Table 8 and Figure 8, the moisture-induced weight gain of lutein after 12 hours at 75% humidity was 0.01%, reaching 4.74% after 30 days. While humidity has a relatively minor impact on lutein, the product's degradation rate reached 43.56% by the 30-day mark, primarily due to atmospheric oxidation in a non-vacuum environment.
3.3.2 A 10 g sample of 5% lutein was placed in a watch glass and stored in an environment with 92% relative humidity (maintained using a sodium chloride solution) at 25°C. Samples were collected at 12 h, 24 h, 48 h, 60 h, 10 days, 15 days, and 30 days to evaluate appearance, active content, and moisture-induced weight gain, and to calculate the degradation rate.
|
Time |
0 h |
12 h |
24 h |
48 h |
60 h |
10 days |
15 days |
30 days |
|
Color |
Orange-yellow |
Orange-yellow |
Orange-yellow |
Orange-yellow |
Orange-yellow |
Orange-yellow |
Pale orange-yellow |
Pale orange-yellow |
|
Content |
5.28% |
5.24% |
5.12% |
5.00% |
4.85% |
4.21% |
3.56% |
2.18% |
|
Sample weight |
10.0353g |
10.0458g |
10.0962g |
10.1745g |
10.2968g |
10.3751g |
10.5689g |
10.6982g |
|
Degradation rate |
0% |
0.76% |
3.03% |
5.30% |
8.14% |
20.27% |
32.58% |
58.71% |
|
Weight gain on moisture absorption |
0% |
0.10% |
0.61% |
1.39% |
2.61% |
3.39% |
5.32% |
6.61% |
Table 9: Experiment on Factors Influencing Results at 92% Humidity (25°C)
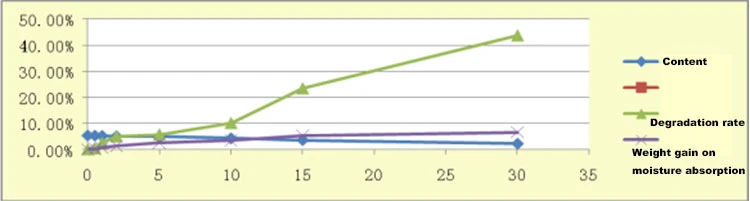
Figure 9
As shown in Table 9 and Figure 9, the moisture-induced weight gain of lutein is 0.76% after 12 hours at 92% humidity, and reaches 6.61% after 30 days-exceeding the 5% threshold. This indicates that 92% humidity has a significant impact on lutein; by day 30, the product's degradation rate reaches 58.71%, a change primarily driven by atmospheric oxidation in a non-vacuum environment.
4. Experimental Conclusion
Based on the experiments above, it can be concluded that lutein exhibits good stability when stored at temperatures between 25°C and 40°C, at a humidity level below 75%, and under vacuum-packed, light-protected conditions.
You can contact us directly or email donna.zh@kingsci.com to obtain further information and free lutein samples.


